Number of Flats Sold in Wandsworth Falls Sharply
Prices close to historic highs but turnover well below historic norms
There is good news and bad news for Wandsworth estate agents in the most recently published figures on the local property market.
According to the Land Registry, property prices in the SW18 post code area averaged £745,113 in the first quarter of 2106. This is up by 16.4% compared with the same period last year.
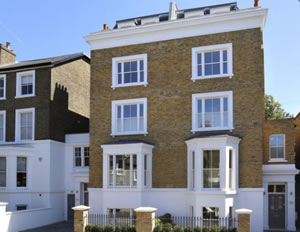
The average terraced property in the area is now worth over a million pounds - the highest level ever. The only reason the overall average is not at record levels is the lack of activity at the top end of the market.
The highest priced sale so far this year was of a six bedroomed house on Elsynge Road which went for £3,100,000, having been advertised with a guide price of £3,395,000. Local agents are reporting that buyers of houses at the top end of the market are very price-sensitive. Despite a relative lack of choice in the multi-million pound bracket, vendors of properties that are perceived as 'over-priced' are having to settle for lower than asking price offers.
On the other hand there has been a collapse in the number of flats being sold in the area. The number of transactions in this kind of property more than halved in the first three months of the year compared with 2015. Only 110 units were reported as sold which is against the expectation of many agents who were expecting a busy period in the run up to stamp duty changes that were introduced on 1 April when a 3% surcharge on second homes came into force.

The Land Registry’s March data for London shows a 13.9% rise over the last year to £534,785. This is higher than any other part of the country and makes the London average twice the average for any other part of the country, including the South East.
Annual growth of 6.7% in March brings the average house price in England and Wales to £189,901.
The latest survey by the Royal Institution of Chartered Surveyors (RICS) has revealed that growth in the private and public housing sectors in London slowed down considerably. Private housing workloads rose at their slowest pace since Q4 2012, with only 20% more of those working in the sector reporting a rise in activity rather than a fall over the first quarter of 2016. During the last quarter of 2015 that figure was 44 per cent.
This easing in the private housing sector has not been offset by any increase in the construction of public housing, with growth in this sector remaining broadly unchanged from the previous quarter, and just 11% more surveyors reporting a rise rather than a fall in activity.
RICS Chief Economist, Simon Rubinsohn, said, “On the surface, it might seem surprising that we are witnessing a slowdown in the construction sector just a few months after hearing the Chancellor’s ‘We Are The Builders’ speech, given the Government’s significant commitment to this sector. One might well ask why growth in private housing workloads is softening at a time when policy is firmly focussed on the creation of new starter homes. We have long held the view that starter homes cannot be the only solution. There is an issue around the availability of land on which new houses can be built, and we would like to see more being done to free up private brownfield sites.
“Our survey tells us that planning delays are one of the biggest barriers to growth in the construction sector. We have recommended that councils work together to create a team of emergency planners who can parachute into boroughs that are experiencing significant delays, therefore reducing a major growth barrier.
“That said, we cannot discount the climate of uncertainty caused by the forthcoming EU referendum. We know that a range of sectors have been affected by these issues as investors look to delay.
If your agent is claiming to be marketing your property effectively and it doesn't appear on WandsworthSW18.com it may be time to choose a new agent.
The numbers below are subject to revision as is it usual that some properties are added late to the Land Registry's database.
Property Prices in Wandsworth SW18 (January - March 2016) |
||||||||
Area |
Semi-det |
Sales |
Terraced |
Sales |
Flat/ mais |
Sales |
Overall average |
Total sales |
| SW18 1 | 1100000 | 4 | 1111111 | 9 | 700977 | 30 | 823937 | 43 |
| SW18 2 | 1650000 | 1 | 1541295 | 10 | 467320 | 14 | 944217 | 25 |
| SW18 3 | 0 | 0 | 1011765 | 17 | 529783 | 20 | 751234 | 37 |
| SW18 4 | 0 | 0 | 793958 | 12 | 461827 | 26 | 566711 | 38 |
| SW18 5 | 1075000 | 1 | 944972 | 23 | 408064 | 20 | 703878 | 44 |
| Total | 1187500 | 6 | 1040490 | 71 | 530330 | 110 | 745113 | 187 |
| Change in quarter | -41.2% | -33.3% | 5.1% | -7.8% | -3.1% | -63.9% | 6.6% | -52.9% |
| Change in year | -21.5% | -40.0% | 10.1% | 6.0% | 2.9% | -54.0% | 16.4% | -41.2% |
| Change in three years | 23.0% | -60.0% | 39.2% | -16.5% | 41.1% | -41.5% | 43.7% | -35.5% |
| Change in five years | 14.7% | -79.3% | 58.9% | -26.0% | 48.8% | -17.9% | 30.0% | -29.7% |
| Change in ten years | 105.0% | -76.0% | 114.8% | -48.2% | 80.1% | -58.3% | 92.3% | -56.8% |
Copyright notice: All figures in this article are based on data released by the Land Registry. The numbers are derived from analysis performed by wandsworthsw18.com. Any use of these numbers should jointly attribute the Land Registry and wandsworthsw18.com.
May 17, 2016Related links
|