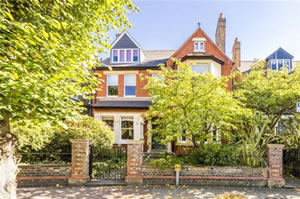
Wandsworth House Prices Hit Record Levels
SW18 property market continues to rise following Brexit vote
Property prices in Wandsworth have confounded the expectations of many by continuing to rise following the vote to leave the EU. They have moved to new all-time highs during the autumn.
In the three months after the Brexit vote the average price in the SW18 post code area was £823,853, up by 13.3% compared to the same period last year.
Houses rather than flats seem to have attracted most buyer interest with volumes and prices increasing whereas flats and maisonettes have seen fewer sales.
Knight Frank estate agents say that household sentiment became more "confident about price rises" although they admit this claim was based on "sentiment rather than actual transactions or applications".
Across the board local agents are reporting that a lack of supply, particularly in the top end of the market, as well as low interest rates, are underpinning high prices.
As is usual in this kind of market, realistically priced houses are selling, whilst more demanding prices are taking a hit. Savills' 2016 market analysis reports that family-sized properties in Wandsworth "continue to offer good value in comparison to central London", while "the ongoing regeneration in Battersea and Nine Elms is changing the profile of housing to the north of the area along the waterfront and developments such as the Ram Quarter are reviving parts of Wandsworth Town."
The fewer sales in flats and maisonettes had already been hit
in the previous quarter by the 3% Stamp Duty surcharge on 'Additional Homes' and concern over the outcome of the Brexit referendum, and there has been no meaningful recovery in this sector in the period from July to September.
Overall transaction levels remain at depressed levels with turnover in the property market at around half the level seen over the last few years.
The most expensive property sold locally during the quarter was on Westover Road, changing hands for £4,655,100.
The short term indications for the market appear to be positive. Mortgage approvals for house purchases rose to a three-month high in September according to the Bank of England, and RICS, the surveyors’ industry group, have reported that buyer inquiries were the highest since February. They say this indicates that market activity is recovering after a quieter period earlier in the year due to uncertainty over the referendum.
If your agent is claiming to be marketing your property effectively and it doesn't appear on WandsworthSW18.com it may be time to choose a new agent.
The numbers below are subject to revision as is it usual that some properties are added late to the Land Registry's database.
Property Prices in Wandsworth SW18 (July - September 2016) |
||||||||||
| Area | Detached | Sales | Semi-det | Sales | Terraced | Sales | Flat/ mais |
Sales | Overall average | Total sales |
|---|---|---|---|---|---|---|---|---|---|---|
| SW18 1 | 1250000 | 1 | 1320000 | 1 | 1100143 | 14 | 668676 | 34 | 814140 | 50 |
| SW18 2 | 2671700 | 3 | 0 | 0 | 1693773 | 11 | 490975 | 29 | 950811 | 43 |
| SW18 3 | 0 | 0 | 1568750 | 2 | 975556 | 9 | 534950 | 23 | 712392 | 34 |
| SW18 4 | 0 | 0 | 0 | 0 | 992249 | 8 | 490019 | 24 | 615576 | 32 |
| SW18 5 | 1375833 | 3 | 1346667 | 3 | 1061300 | 30 | 499397 | 15 | 931323 | 51 |
| Total | 1913229 | 7 | 1416250 | 6 | 1147090 | 72 | 548228 | 125 | 823853 | 210 |
| Change in quarter | -22.7% | 250.0% | 59.6% | 200.0% | 17.1% | 16.1% | -13.2% | -26.9% | 11.3% | -11.4% |
| Change in year | -38.8% | 250.0% | -24.8% | -57.1% | 14.6% | -41.0% | 0.5% | -58.3% | 13.3% | -52.1% |
| Change in three years | -13.8% | 75.0% | 14.7% | -68.4% | 31.0% | -51.0% | 23.4% | -51.6% | 27.9% | -50.9% |
| Change in five years | 67.4% | -30.0% | 54.7% | -71.4% | 71.1% | -51.4% | 64.4% | -32.1% | 56.4% | -42.1% |
| Change in ten years | 119.2% | 75.0% | 69.0% | -88.2% | 126.3% | -62.5% | 71.4% | -72.6% | 100.1% | -70.1% |
Copyright notice: All figures in this article are based on data released by the Land Registry(© Crown copyright 2016). The numbers are derived from analysis performed by wandsworthsw18.com. Any use of these numbers should jointly attribute the Land Registry and wandsworthsw18.com.
November 9, 2016Related links
|

