Fears Grow of Unsold Property Glut in Wandsworth
Only two new build homes reported as being sold so far this year
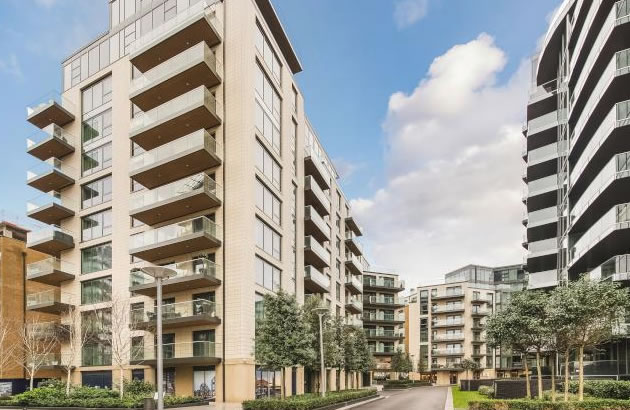
Meridian House in Battersea Reach
The year so far has seen no recovery in the already moribund property market in Wandsworth. There has been little over a sale per day reported to the Land Registry in the SW18 post code area. At its peak levels of activity the amount of transactions has been five times this level.
Demand for new build properties appears to have almost completely ground to a halt with only two sales reported since the end of 2017. With a large number of units in the pipeline and many of these in developments without riverside views which are more difficult to shift, there is a danger of a serious overhang of unsold inventory.
One of the new build sales reported as sold was for an apartment in Meridian House the Berkeley development on Battersea Reach. At a price of £2,596,978 it is believed to have a view of the Thames.
The poor sales numbers are also likely to be painful for local estate agents with too many players chasing too many commissions. However activity in larger family houses continues to be relatively robust with several sales of this type of property taking place at prices above £2million. The highest priced home reported as sold so far this year was a semi-detached property on Henderson Road that changed hands for £2,850,000.
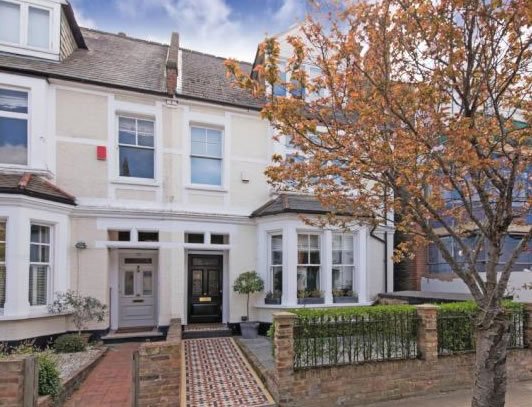
House on Henderson Road sold for highest price so far this year
The average price of a home in the SW18 post code area has remained firm with the level rising by 7.4% over the course of last year to £788,271. However, the rise is largely due to transaction levels holding up better for houses than flats. Each property type has fallen over the last year but the average has risen due to a higher proportion of more expensive houses being sold.

According to the Nationwide House Price Index, property values in London as a whole fell by 1% in March compared with the same month last year. For the UK overall prices are up by 2.1% and the gap between the capital and the rest of the country has been slowly reduced over the last few months.
Commenting on the figures, Robert Gardner,
Nationwide's Chief Economist, said: “Looking ahead, much will depend on how broader
economic conditions evolve, especially in the labour market,
but also with respect to interest rates. Subdued economic
activity and the ongoing squeeze on household budgets is
likely to continue to exert a modest drag on housing market
activity and house price growth this year."
Home ownership rates have declined across all English regions over the past decade. While the decline has been fairly uniform across regions, the biggest reduction has been in London, where the home ownership rate has fallen from 57% to 47%. The counterpart to this has been robust growth in the private rental sector; for example, 30% of households in London now rent.
The RICs say that their surveyor members report on balance an expectation of no price rises over the next 12 months representing the joint lowest reading since February 2013. Regionally, there continues to be significant variation in the house price indicator. London, exhibits the weakest feedback, with a net balance of -47% of respondents citing further price declines.
If your agent is claiming to be marketing your property effectively and it doesn't appear on WandsworthSW18.com it may be time to choose a new agent.
The numbers below are subject to revision as is it usual that some properties are added late to the Land Registry's database.
Property Prices in Wandsworth SW18 (January - March 2018) |
||||||||||
| Area | Detached | Sales | Semi-det | Sales | Terraced | Sales | Flat/ mais |
Sales | Overall average | Total sales |
|---|---|---|---|---|---|---|---|---|---|---|
| SW18 1 | 0 | 0 | 1181667 | 3 | 944857 | 7 | 681772 | 15 | 815423 | 25 |
| SW18 2 | 0 | 0 | 0 | 0 | 1296200 | 5 | 477860 | 12 | 718549 | 17 |
| SW18 3 | 1575000 | 1 | 1956143 | 7 | 953598 | 13 | 507706 | 17 | 955152 | 38 |
| SW18 4 | 0 | 0 | 0 | 0 | 828286 | 7 | 494300 | 22 | 574917 | 29 |
| SW18 5 | 0 | 0 | 1026667 | 3 | 967662 | 17 | 587529 | 17 | 797791 | 37 |
| Total | 1575000 | 1 | 1562923 | 13 | 974286 | 49 | 547645 | 83 | 788271 | 146 |
| Change in quarter | 27.8% | -50.0% | 19.2% | 85.7% | -2.0% | -26.9% | -10.3% | -43.5% | 4.6% | -34.5% |
| Change in year | 22.1% | -50.0% | -18.0% | 62.5% | -1.6% | -23.4% | -3.8% | -49.4% | 7.4% | -38.7% |
| Change in three years | 59.9% | -50.0% | 3.3% | 30.0% | 3.1% | -26.9% | 6.2% | -65.3% | 23.1% | -54.1% |
| Change in five years | 85.8% | -50.0% | 61.8% | -13.3% | 30.4% | -42.4% | 45.7% | -55.9% | 52.0% | -49.7% |
| Change in ten years | 14.5% | 0.0% | 126.3% | 18.2% | 57.2% | -26.9% | 42.4% | -50.3% | 69.0% | -40.7% |
Copyright notice: All figures in this article are based on data released by the Land Registry(© Crown copyright 2018). The numbers are derived from analysis performed by wandsworthsw18.com. Any use of these numbers should jointly attribute the Land Registry and wandsworthsw18.com.
May 9, 2018Related links
|