Latest House Price Figures Reveal A Subdued Local Property Market
Brexit and interest rate fears contribute to wary buyer sentiment
The average price of a home in the SW18 post code area has remained firm with the level rising by 7.4% over the course of last year to £788,271. However, the rise is largely due to transaction levels holding up better for houses than flats. Each property type has fallen over the last year but the average has risen due to a higher proportion of more expensive houses being sold.
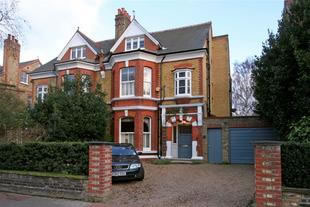
A house in Westover Road (above) sold for more than £4 million in May, which is the eighth highest price achieved in SW18 in the last decade. Leafy and attractive Westover Road is known locally as the first 'Millionaires' Row' in Wandsworth, with the large red brick houses first achieving £1 million sale prices back in the 1990s.
However there were fewer than ten larger houses sold in the SW18 area in the second quarter of 2018, and prices are generally well below the 2013/14 peak. A new report from Coutts Bank claims that, "The amount of London prime property exchanging hands is still a long way off what it used to be - as little as half of what it was in 2013."
Savills, who run two estate agencies in the area, say that there are signs of a "bottoming out" of the prime London market. Uncertainty surrounding Brexit and possible future interest rate rises have cooled intensity in prices "coming under increasing pressure from fragile buyer sentiment".

The latest House Price Index data published by the Land Registry shows that London prices are the only ones that have fallen over the last year (May 2017-May 2018) with the average now £478,853.
Figures for July from the Nationwide House Price Index show that the average price of a home in the UK rose by 2.5% to £217,010.
The was before the Bank of England’s Monetary Policy Committee (MPC) increased rates at the beginning of August from 0.5% to 0.75%.
However here is not a high degree of concern that the rise in interest rates will have much impact on the property market. Commenting on the figures, Robert Gardner, Nationwide's Chief Economist, said, “Providing the economy does not weaken further, the impact of a further small rise in interest rates on UK households is likely to be modest.
“This is partly because only a relatively small proportion of borrowers will be directly impacted by the change. Most lending on personal loans and credit cards is fixed or tends to be unaffected by movements in the Bank Rate. Similarly, in recent years, the vast majority of new mortgages have been extended on fixed interest rates.”
Local estate agent Allan Fuller, who has run a family business covering south west London since the 1980s, adds, "The fact that it is only the second rise in nearly 10 years does make it highly newsworthy. What is more relevant though is where the interest rates will be heading... for UK property this action on its own will have little effect, too many more soon could well be detrimental but hopefully this is extremely unlikely."
If your agent is claiming to be marketing your property effectively and it doesn't appear on WandsworthSW18.com it may be time to choose a new agent.
The numbers below are subject to revision as is it usual that some properties are added late to the Land Registry's database.
Property Prices in Wandsworth SW18 (April-June 2018) |
||||||||
| Area | Semi-det | Sales | Terraced | Sales | Flat/ mais |
Sales | Overall average | Total sales |
|---|---|---|---|---|---|---|---|---|
| SW18 1 | 0 | 0 | 1081000 | 5 | 611918 | 74 | 641606 | 79 |
| SW18 2 | 4260000 | 1 | 1300667 | 6 | 521429 | 14 | 922095 | 21 |
| SW18 3 | 1725000 | 2 | 1024735 | 13 | 502079 | 19 | 773854 | 34 |
| SW18 4 | 0 | 0 | 682857 | 7 | 427595 | 18 | 499068 | 25 |
| SW18 5 | 1266667 | 3 | 949476 | 21 | 509857 | 7 | 880903 | 31 |
| Total | 1918333 | 6 | 985568 | 52 | 555963 | 132 | 716561 | 190 |
| Change in quarter | 18.9% | -60.0% | 5.5% | -17.5% | -2.9% | -5.7% | -4.8% | -13.2% |
| Change in year | 4.9% | -14.3% | -7.2% | -17.5% | -5.2% | -14.8% | -7.6% | -16.7% |
| Change in three years | 20.9% | -25.0% | -1.6% | -41.6% | 7.9% | -52.9% | 7.5% | -50.3% |
| Change in five years | 35.1% | -76.9% | 32.2% | -47.5% | 32.6% | -52.9% | 24.8% | -53.5% |
| Change in ten years | 93.9% | -33.3% | 61.8% | -34.2% | 47.4% | -36.5% | 52.3% | -36.2% |
Copyright notice: All figures in this article are based on data released by the Land Registry(© Crown copyright 2018). The numbers are derived from analysis performed by wandsworthsw18.com. Any use of these numbers should jointly attribute the Land Registry and wandsworthsw18.com.
August 15, 2018