Wandsworth Buyers Finally Find Prices Tipping In Their Favour
As vendors get realistic about pricing
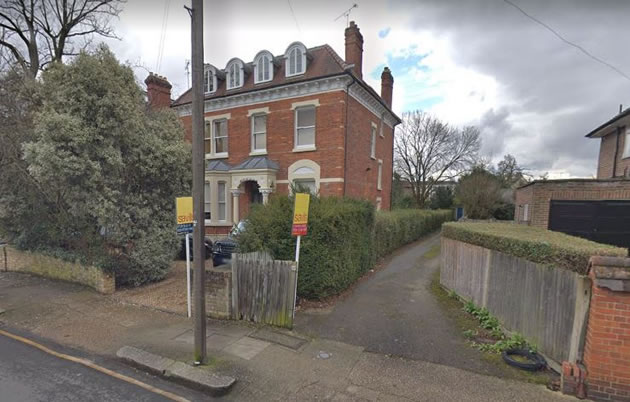
A double-fronted detached house on West Hill Road sold for £3.1 million Image: Google Streetview
Wandsworth's property market is becoming ever more complex. Amid widely reported stagnation in London and the South East, Wandsworth is experiencing a small decrease in average sales prices but a much larger drop in volume. There is clear indication that vendors are wising up to marketing their property at realistic prices. A large detached house on West Hill Road sold for £3.1 million in February, having originally been marketed at almost £4 million back in 2016.
Volume of sales has fallen significantly in SW18 compared to the previous sixth months, with a total of 159 properties selling in the first quarter of 2019 compared to 221 in the final quarter of 2018. However, numbers from the Land Registry for the first quarter of 2019 indicate that the average sale price across the postcode was £780,081 which is a -0.4% decrease compared to the last quarter but a 4.7% increase over the last year.
According to Lucy Pendleton of local agents James Pendleton "The undeniable correction now at hand in London is the adjustment many have been waiting for... Sellers have needed a firm hand to guide them to more realistic prices recently. This is going to stoke demand and transaction volumes which is what the market needs."
Decrease is the volume of sales has been most keenly felt throughout Wandsworth in the semi-detached and terraced housing market which fell by 37.5% and 39% respectively compared to the last quarter of 2018. Brexit still appears to be affecting sales volumes. Robert Butterworth of Jackson-Stops says, "At present a significant amount of buyers and sellers in London are holding off on making decisions before firm agreements have been made."

London-wide, the Nationwide’s House Price Index showed that the capital had the fastest pace of decline in the UK in the first quarter of 2019 with prices down by 3.8% compared with the same period in 2018, averaging £455,594. This is the steepest fall for the area since 2009 and the seventh consecutive quarter in which prices have declined. The Nationwide’s analysts say this partly reflects the level of price outperformance previously seen in the capital and the impact of policy changes on the Buy to Let market which has had a bigger effect on London because the private rental sector accounts for a larger proportion of the housing stock than elsewhere in the country.
Commenting on the figures, Robert Gardner, Nationwide's Chief Economist, said, “UK house price growth remained subdued in March, with prices just 0.7% higher than the same month last year.
“Indicators of housing market activity, such as the number of property transactions and the number of mortgages approved for house purchase, have remained broadly stable in recent months, even though survey data suggests that sentiment has softened.
“Measures of consumer confidence weakened around the turn of the year and surveyors report that new buyer enquiries have continued to decline, falling to their lowest level since 2008 in February.”
The March 2019 RICS UK Residential Survey results show little departure from the subdued picture evident across the sales market for several months now. They say forward looking indicators suggest this lack of momentum is likely to continue for a while longer, although perceptions on the twelve month outlook are a little more sanguine. However London and the South East continue to display the weakest sentiment in terms of prices.
If your agent is claiming to be marketing your property effectively and it doesn't appear on WandsworthSW18.com it may be time to choose a new agent.
The numbers below are subject to revision as is it usual that some properties are added late to the Land Registry's database.
Property Prices in Wandsworth SW18 (January - March 2019) |
||||||||||
| Area | Detached | Sales | Semi-det | Sales | Terraced | Sales | Flat/ mais |
Sales | Overall average | Total sales |
|---|---|---|---|---|---|---|---|---|---|---|
| SW18 1 | 3100000 | 1 | 0 | 0 | 1025050 | 11 | 664368 | 30 | 816824 | 42 |
| SW18 2 | 0 | 0 | 1450000 | 1 | 1367500 | 6 | 372889 | 9 | 813187 | 16 |
| SW18 3 | 1032500 | 2 | 2455000 | 6 | 987409 | 11 | 488029 | 20 | 959413 | 39 |
| SW18 4 | 0 | 0 | 0 | 0 | 925000 | 4 | 455740 | 24 | 522777 | 28 |
| SW18 5 | 0 | 0 | 1106667 | 3 | 839550 | 15 | 546697 | 16 | 725306 | 34 |
| Total | 1721667 | 3 | 1950000 | 10 | 992240 | 47 | 532652 | 99 | 780081 | 159 |
| Change in quarter | - | - | 29.8% | -37.5% | 1.7% | -39.0% | -2.9% | -32.2% | -0.4% | -34.8% |
| Change in year | - | - | 20.9% | -33.3% | 6.8% | -27.7% | -8.0% | -36.1% | 4.7% | -32.6% |
| Change in three years | - | - | 119.7% | 400.0% | 1.2% | -24.2% | -15.7% | -42.1% | 5.3% | -32.9% |
| Change in five years | - | - | 29.7% | -58.3% | 14.4% | -40.5% | 1.6% | -67.4% | 19.3% | -61.3% |
| Change in ten years | - | - | 82.2% | 25.0% | 90.3% | 34.3% | 81.7% | -14.7% | 99.2% | -1.9% |
Copyright notice: All figures in this article are based on data released by the Land Registry(© Crown copyright 2018). The numbers are derived from analysis performed by wandsworthsw18.com. Any use of these numbers should jointly attribute the Land Registry and wandsworthsw18.com.
May 13, 2019